Utility Billing Audit Dashboard
See the billing gap. Work the next action.
Reconcile water, sewer, trash, and drainage evidence across billing, the general ledger, and meters. Then turn each discrepancy into account-level work that staff can assign, verify, and close.
Every screen on this page shows demonstration data for a fictional city. The dashboard itself requires staff sign-in.

From a reconciliation to a finished piece of work.
Most billing reports stop at a variance. This one follows the difference to the accounts behind it, explains the ones that are legitimate, and hands the rest to the people who can fix them.


01 · Reconcile
Trace utility billing to the ledger.
Each month, billing is compared with ledger postings for water, sewer, trash, and drainage. Every complete month receives an explicit explanation: an exact match, a match within tolerance, a manual journal that bridges the gap, export timing, or an unexplained difference.
Integrity checks run before any comparison is trusted. Source files are verified again, and line detail must agree with the rollup.
Revenue Assurance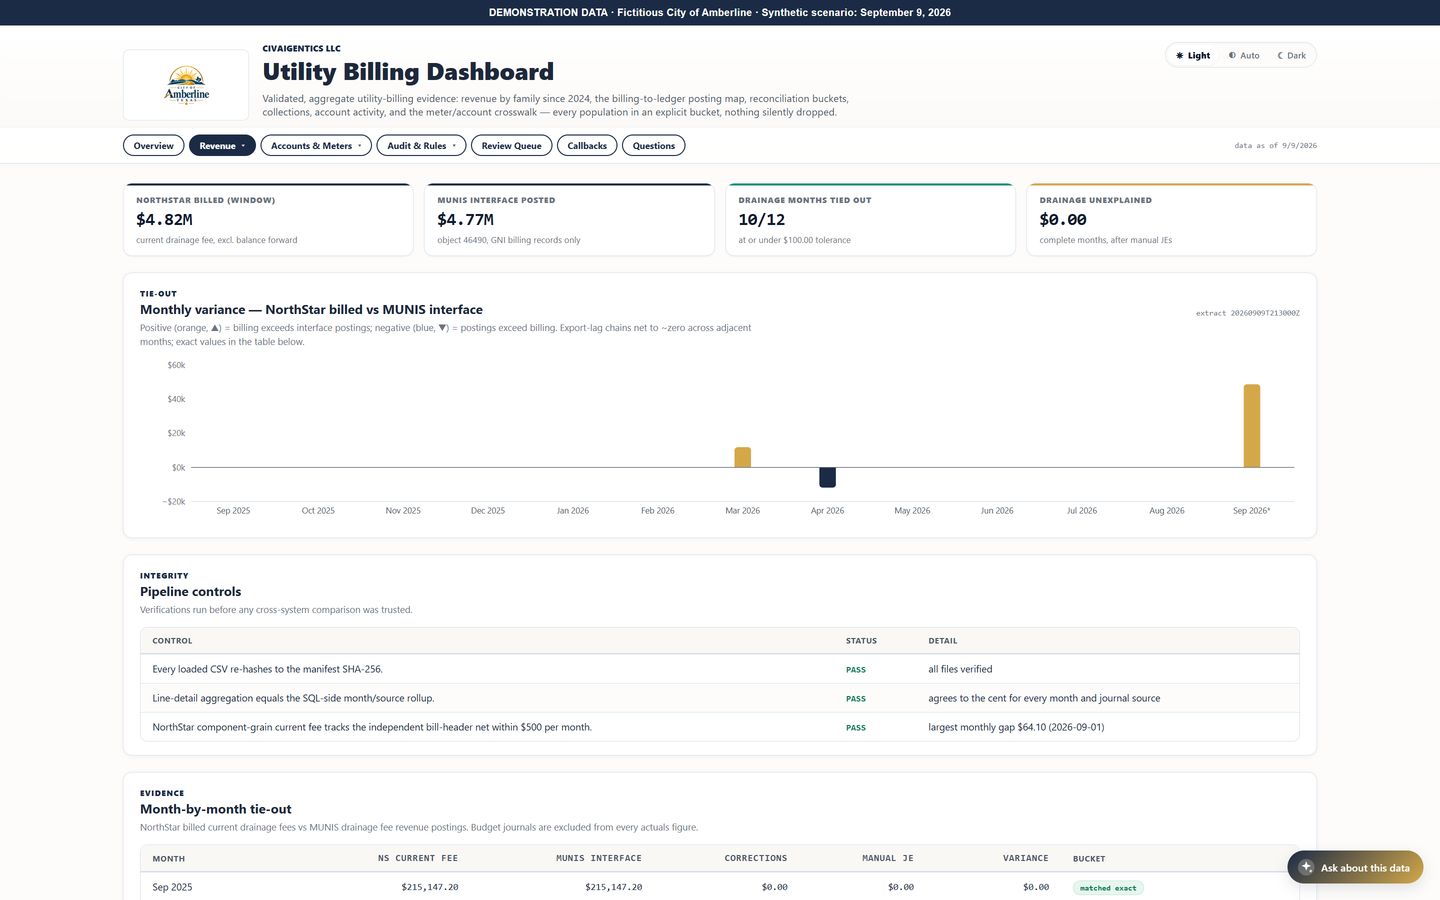
Exhibit 2. Demonstration data for the fictional City of Amberline, not a client result. 02 · Explain
Write down why an account is not an error.
The rules that explain a legitimate non-charge are recorded in order, each with the statement from billing staff that authorises it. Park irrigation in season, fire hydrants, first bills, and lawn meters stop appearing as problems.
An account explained by a rule is kept and marked. Nothing is silently dropped, so a wrong rule stays visible.
Billing Rules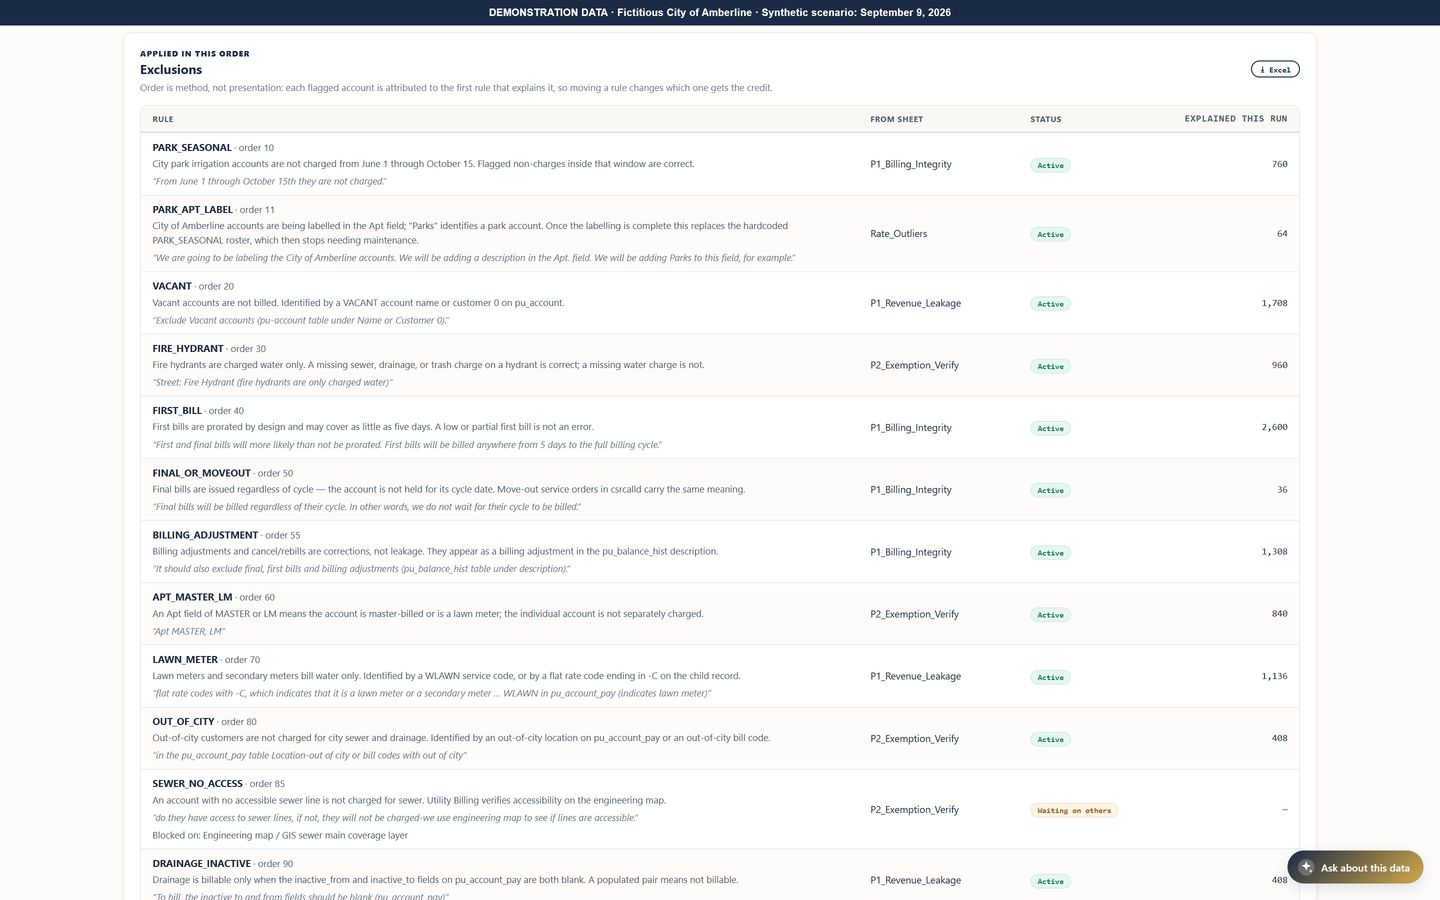
Exhibit 3. Demonstration data for the fictional City of Amberline, not a client result. 03 · Assign
Give staff a concrete next action.
Discrepancies become account-level review queues. Each queue states the reason, the recommended action, and the screen staff should check to verify it.
Status, assignee, and notes are saved with a record of who changed what and when. Filtered views can be shared by link, and worklists export to Excel.
Review Queue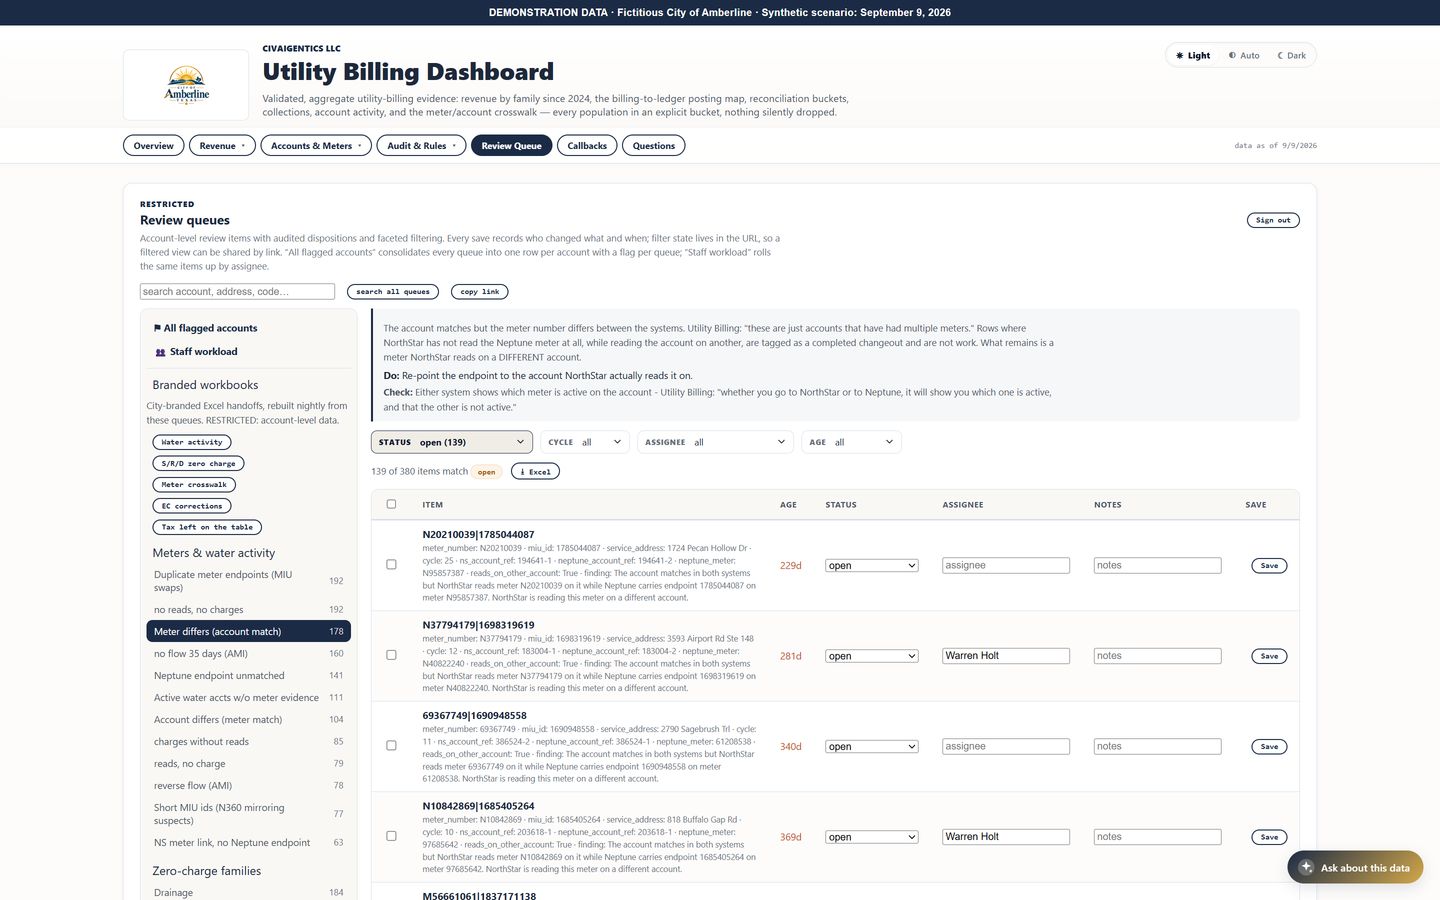
Exhibit 4. Demonstration data for the fictional City of Amberline, not a client result. 04 · Follow up
See one account across every flag.
A single row per account shows every queue it appears in, so overlapping issues are worked once. Filters narrow the view by service, by new or reopened work, and by what a rule has already explained.
A workload view rolls the same items up by assignee, with recent closures and the oldest open work.
All flagged accounts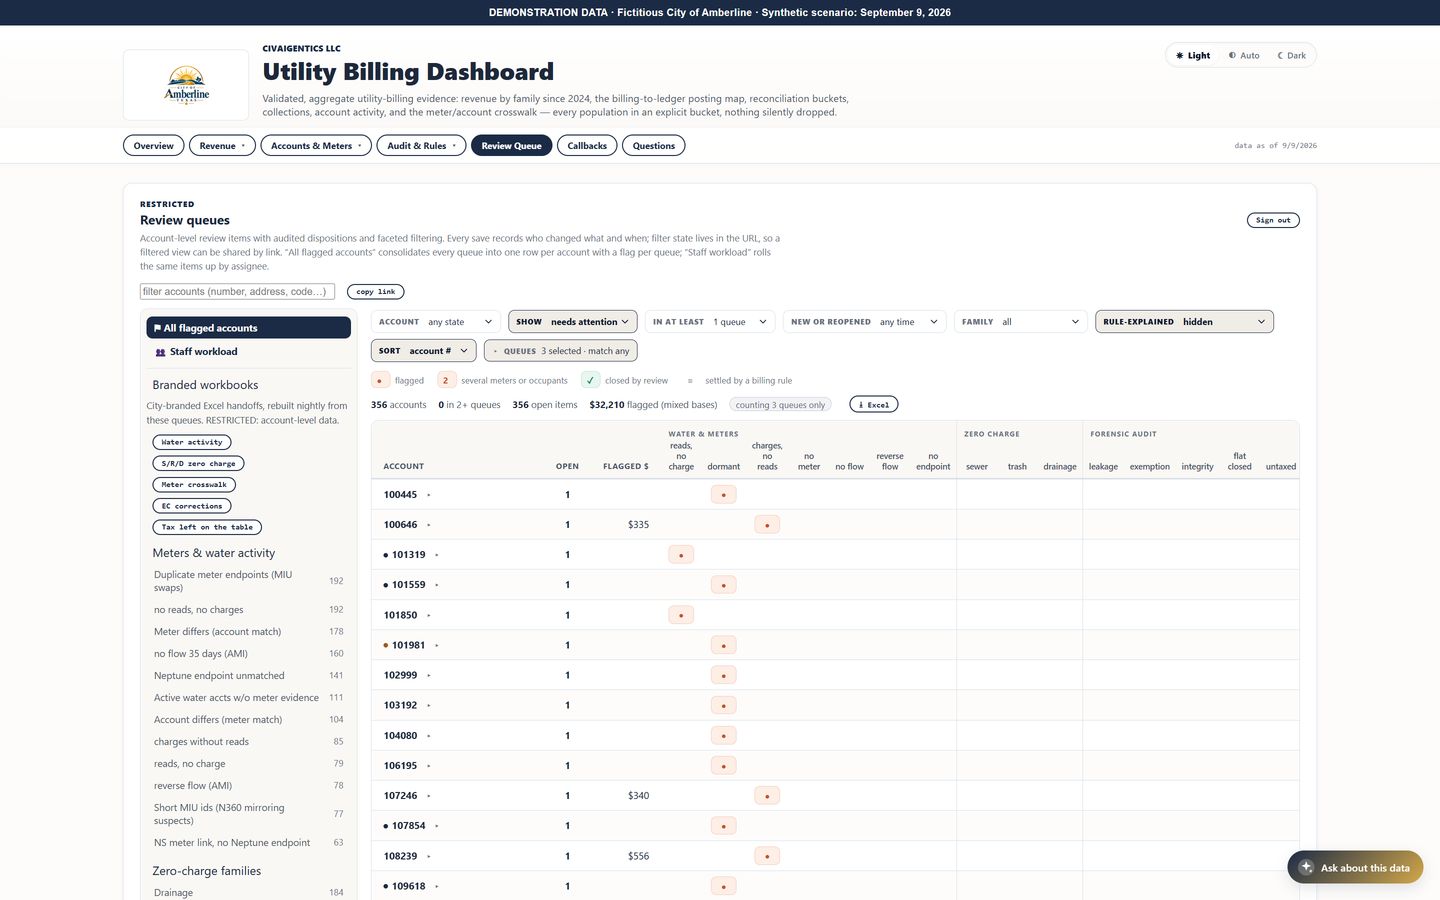
Exhibit 5. Demonstration data for the fictional City of Amberline, not a client result. 05 · Measure
Explain program value with its measurement basis.
Program results are reported with the method behind each figure: what was measured, against which baseline, and what is still a projection. Rate changes and growth are shown separately from recovery.
Billed changes are kept separate from cash collected, and the page downloads as a branded report.
Program Impact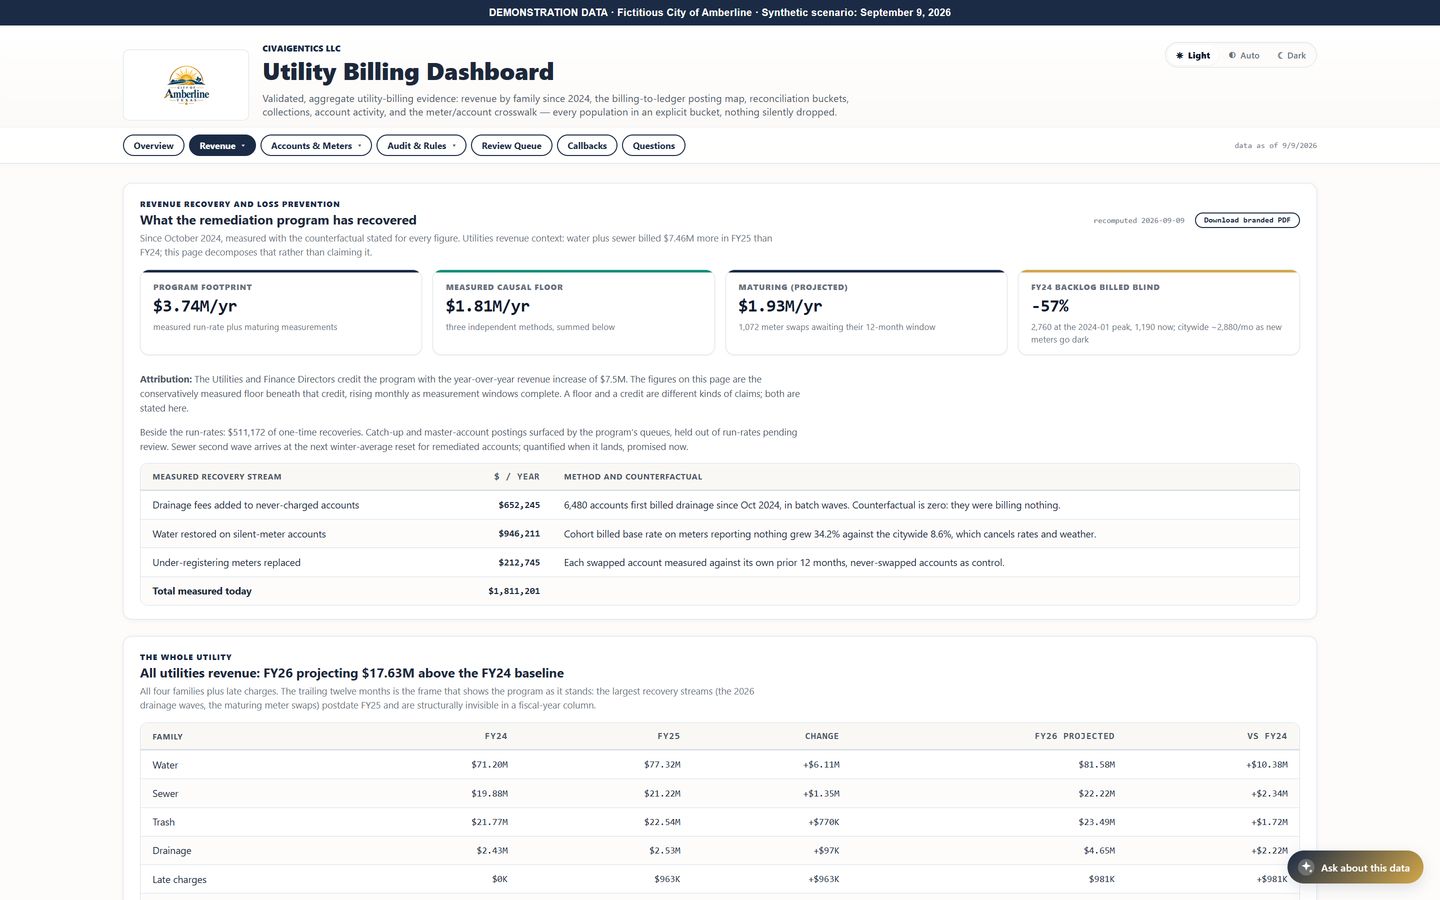
Exhibit 6. Demonstration data for the fictional City of Amberline, not a client result.
Fifteen pages, each answering one question.
Leadership reads the aggregate pages. Billing, finance, and meter staff work the queues behind them.
- Overview
- See what needs attention and what has changed.
- Revenue Map
- Trace each utility family to its ledger accounts.
- Revenue History
- Explain trends using consistent periods.
- Revenue Assurance
- Make reconciliation differences explainable.
- Collections
- Separate money billed, money received, and balances owed.
- Program Impact
- Explain program value with its measurement basis.
- Accounts
- Find services whose billing deserves review.
- Drainage Tiers
- Separate rate-driven growth from improved coverage.
- Meters & Crosswalk
- Connect meter evidence to billing accounts.
- Forensic Audit
- Turn audit populations into focused review.
- Billing Rules
- Explain why an account is flagged or excluded.
- Codes & Ordinances
- Put the governing authority beside the analysis.
- Review Queue
- Give staff a concrete next action.
- Callbacks
- Keep resident follow-up visible to staff.
- Questions
- Resolve the dependencies holding work up.
An assistant that shows its evidence.
Staff can ask about the published figures by text or voice. Each answer cites its source and says whether a figure was published or calculated, with the formula shown. When the evidence is missing, the assistant says so instead of guessing.
Account-level records are kept out of what the assistant can see.
Access that matches the data.
Staff sign in with a password and an authenticator code, and access is granted per application. Aggregate dashboards are separated from account-level queues, and source systems are read, never written to.
Aggregate tables export to CSV, worklists to Excel, and pages print cleanly.
What it does, and what it leaves to the city.
It does
- Reads billing, ledger, and meter data from approved sources on a schedule.
- Classifies every month and every account population into an explicit category.
- Keeps aggregate dashboards separate from account-level work queues.
- Records each queue change with who made it and when.
It does not
- It does not write corrections into the billing system. The city makes rate changes, rebills, and service orders in its own systems.
- It is not a real-time monitor. Data refreshes on a schedule, and the page shows how fresh it is.
- It does not treat a flag as a verdict. Queue items are review items with a verification path, and not every one is recoverable revenue.
- It does not report billed revenue as cash collected.
The dashboard works alongside C.U.R.E. Utilities. CURE manages an audit engagement from evidence to measured results. The dashboard gives ongoing visibility and staff follow-up. The two do not synchronize automatically.
See it with a utility like yours in mind.
We will walk you through the dashboard using the fictional City of Amberline, and talk through which of your sources it would read.
Or call 432-315-3734